
Dongmun ENT

We enhanced an integrated algal bloom management system by connecting buoy sensors, captured images and geospatial information in a single monitoring environment.

About the customer

A specialist in water quality environment systems

Dongmun ENT is a water quality environment company that provides system integration, engineering, automation and plant work, supply of analysis and measurement instruments, water quality measurement services, maintenance and environmental research services for rivers, seawater, groundwater and other water environments. It has built and operated water quality monitoring systems for agencies under the Ministry of Environment, local governments, water and sewage offices, K-water and other sites.

Challenge

Buoy management, water quality analysis and captured data had to be viewed together in one environment

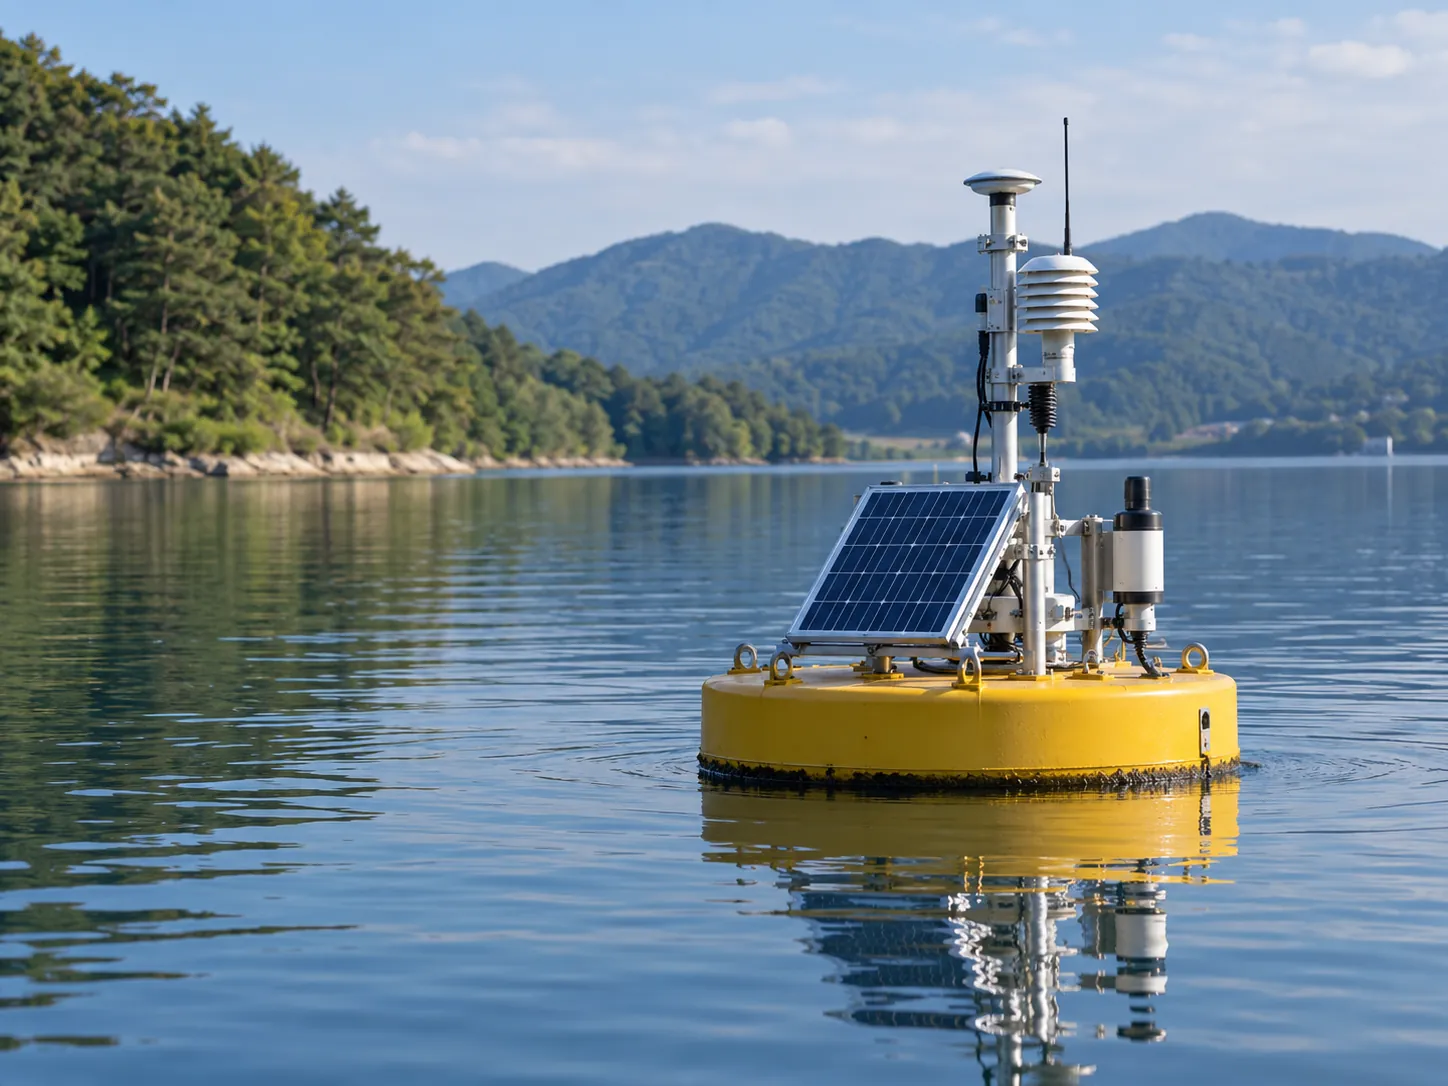
It was necessary to manage the registration, location, configuration, alerts and equipment status of buoys installed in each water system while analyzing and visualizing water quality data such as water temperature, conductivity, dissolved oxygen, pH, turbidity, chlorophyll, phycocyanin and water depth. Because images captured in the field had to be managed along with sensor readings, the key task was to bring different data and equipment together in a single operating flow.

Solution

We connected heterogeneous sensors with water quality, image and geospatial data based on oneM2M

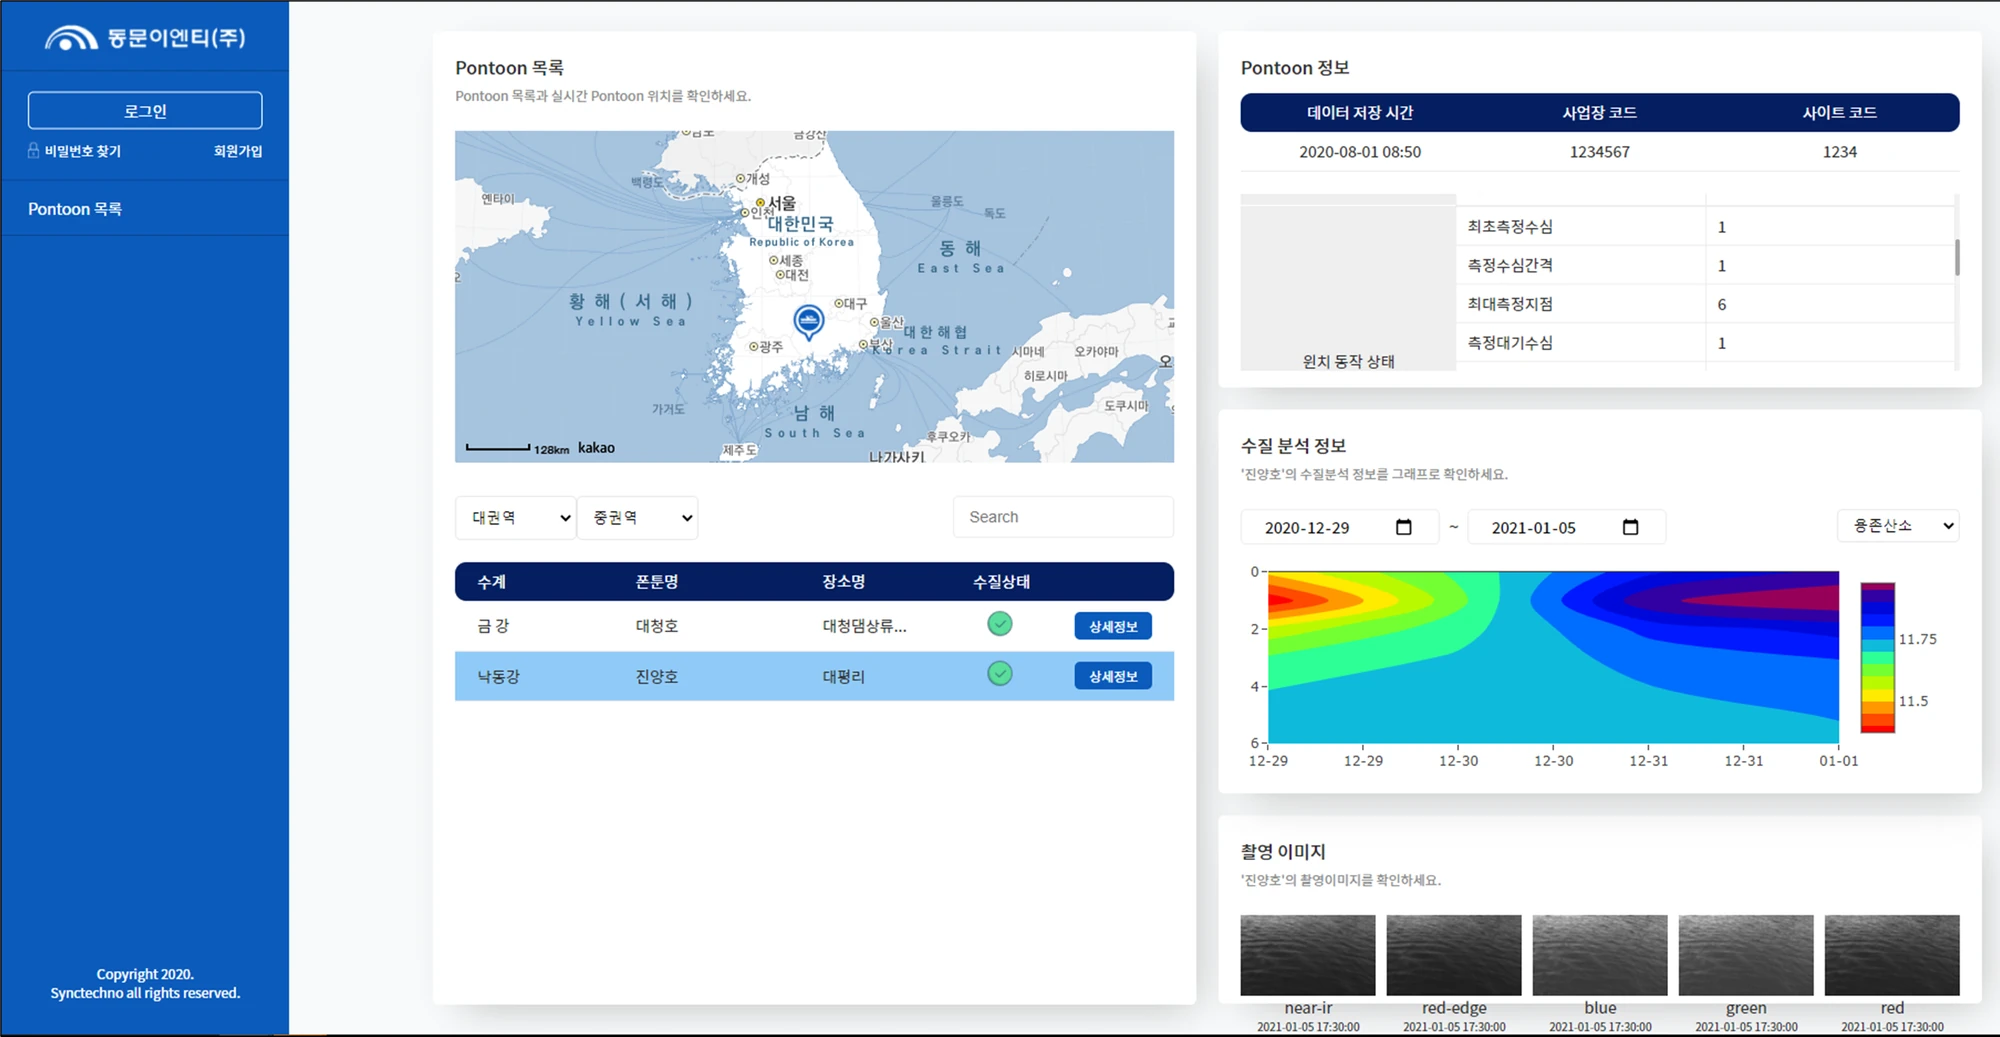
SyncTechno built the integrated algal bloom management system on KETI’s Mobius platform. By applying an open IoT server platform based on the oneM2M standard, we linked data from multiple devices with different formats and visualized water quality analysis results on the operating screen. We combined existing sensor data with images captured by date and river network data from an open geospatial information platform, extending Dongmun ENT’s real-time algal bloom monitoring capabilities.

  1. 01Buoy management

    The system manages the buoy list, real-time and installation locations and equipment status such as voltage and current, and controls configuration and alert functions for each buoy.

  2. 02Integrated water quality information

    Analysis and visualization functions let users compare multiple water quality indicators and check trends on a single screen.

  3. 03Captured image integration

    Images captured at each buoy can be viewed together with sensor data, so readings and field conditions can be assessed at the same time.

Integrated algal bloom management system screen showing buoy locations, water quality analysis and captured images together
Outcome

A system that only showed sensor readings was extended into an algal bloom management environment that also shows field conditions

With equipment management, water quality analysis, captured images and geospatial information connected in a single flow, operators can compare buoy status, water quality changes and actual field conditions together. The existing IoT-based real-time algal bloom monitoring system was enhanced into an integrated management environment that uses both data and field evidence.